


A Data-Driven Approach to Alternative Mobility and Traffic Impacts
Why Bicycle Infrastructure Matters for Transportation Equity
Academic research plays a vital role in helping cities build sustainable transit options, from EV networks to bike infrastructure. Modern urban planning prioritizes safe, equitable travel for everyone. Targeted upgrades such as protected bike lanes, modified traffic signals, and refreshed lane markings offer safe, low-emission travel options that directly reduce traffic congestion. For researchers, urban planners, and decision-makers, planning where bicycle infrastructure investments deliver the greatest reduction in congestion, and how to measure the impact before and after implementation is critical for a smooth transition.

Leveraging the National Transportation Data & Analytics Solution (NTDAS) for Bike Infrastructure Planning
NTDAS offers a powerful platform for evaluating corridor-level traffic behavior and alternative mobility options with unique, robust, and high-quality transportation data sets that are combined with advanced analytics tools.

Key Data Features:
- High-Resolution Speed Metrics: Captures average speeds for road segments at 5-minute intervals, providing immediate visibility into localized traffic behavior.
- Sensitivity to Congestion Fluctuations: Because speed drops sharply during stop-and-go conditions while remaining largely invariant during uncongested periods, NTDAS metrics precisely pinpoint severe bottleneck areas.
- Trend Map Visualizations: Enables visual analysis of local corridor speed trends across customizable hourly, daily, weekly, or monthly timeframes (Figure 1).
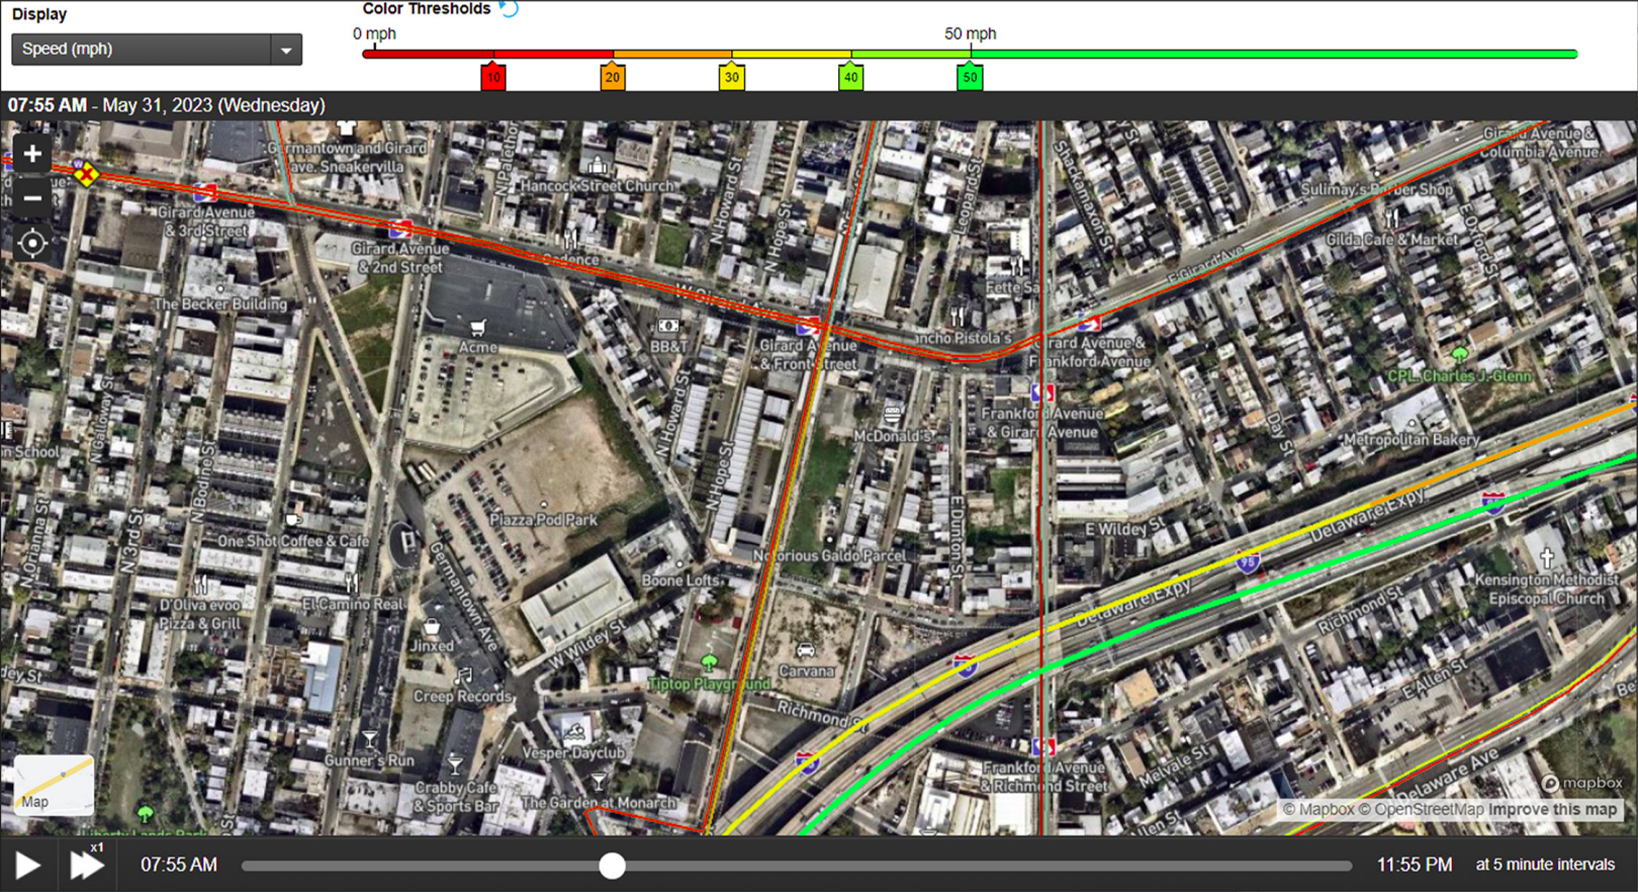
Figure 1: Local route corridor speed trents for a portion of Philadelphia, PA, on 31 May, 2023, from 12:00 to 23:55.
Integrating Transportation and External Mobility Data
To fully understand the systemic impact of new bicycle lanes or signal changes, corridor speed data can be fused with external datasets, such as regional bicycle count counts (Figure 2), rental bike usage, and crash data.
Data Fusion Enables Researchers To:
- Identify High-Impact Investment Zones: Match congested vehicle corridors with high-demand bicycle routes to target capital investments effectively.
- Measure Realized System Impacts: Directly quantify traffic speed changes before, during, and after infrastructure projects are built.
- Advance Transportation Equity: Create safer, multi-modal connections in densely populated corridors where expanded transit access delivers direct benefits to local communities.

Figure 2: Delaware Valley Regional Planning Commission bicycle count data sets for a portion of Philadelphia, PA.
This analytical approach transforms raw speed data into comprehensive impact models, ensuring capital investments support both traffic flow and safe, equitable mobility.

Driving the Future of Equitable Urban Mobility
By combining high-resolution speed analytics with regional bike usage and safety metrics, academic institutions and transportation agencies can guide infrastructure projects toward proven, measurable outcomes. Utilizing NTDAS tools to plan and evaluate bicycle infrastructure accelerates the transition toward livable, resilient communities and a more equitable transportation ecosystem for all travelers.