


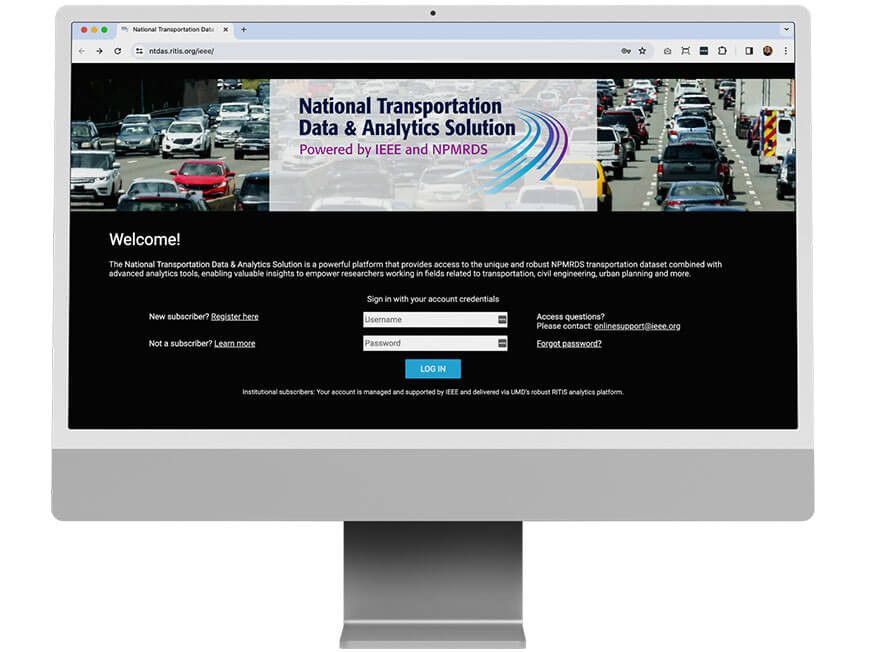
Dynamic insights powered by IEEE and the NPMRDS Database
Transportation is an integral part of our lives, and analyzing the metrics and performance of transit can provide insights that can lead to better conditions. The National Transportation Data & Analytics Solution allows academic researchers to understand, analyze, and leverage the speed data and travel time data of the United States to support their research and teaching in transportation and engineering and apply it to use cases across economics, business, policy, and others.
National Transportation Data & Analytics Solution tools snapshot
Given the unique and robust dataset coupled with powerful analytics capabilities, the platform allows researchers to study historical trends and future projections, anomalies and correlations associated with a variety of urban and suburban related applications including planning, design, traffic operations and management, freight analysis, safety analysis, congestion analysis, and microclimate studies.
Dashboard
Congestion Scan
Massive Data Downloader
Corridor Speed Bins
Dashboard
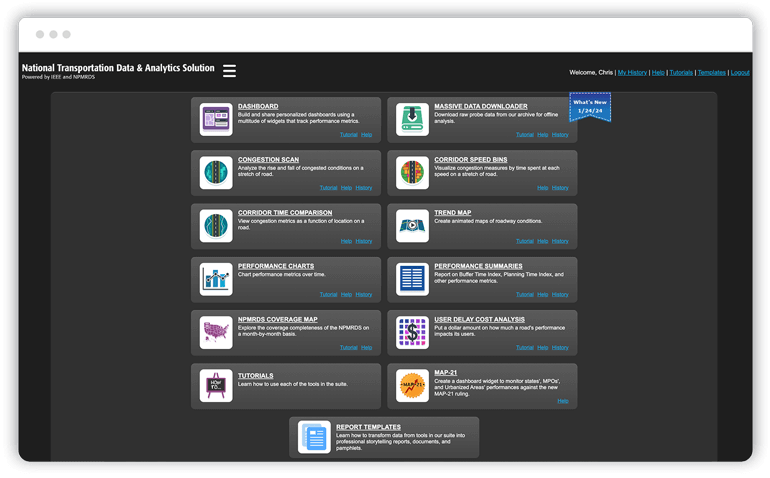
Create your own personal dashboards to monitor corridor performance in regions of interest.
Congestion Scan
Analyze the rise and fall of congested conditions on a stretch of road.
Massive Data Downloader
Download raw probe data from our archive for offline data analysis.
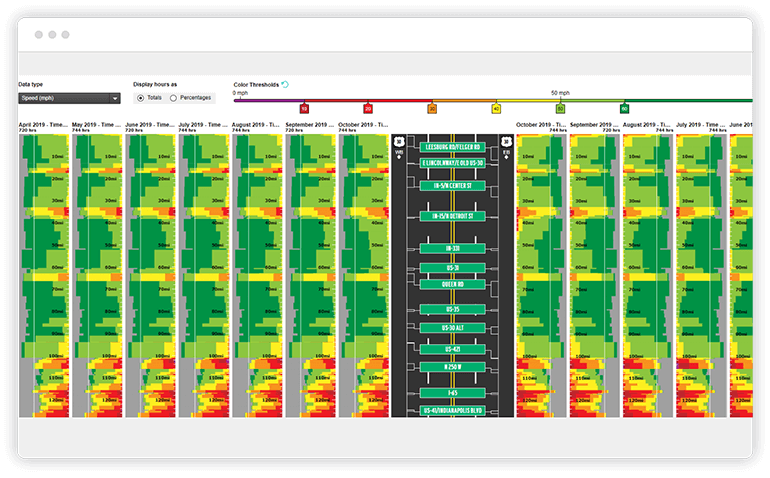
Corridor Speed Bins
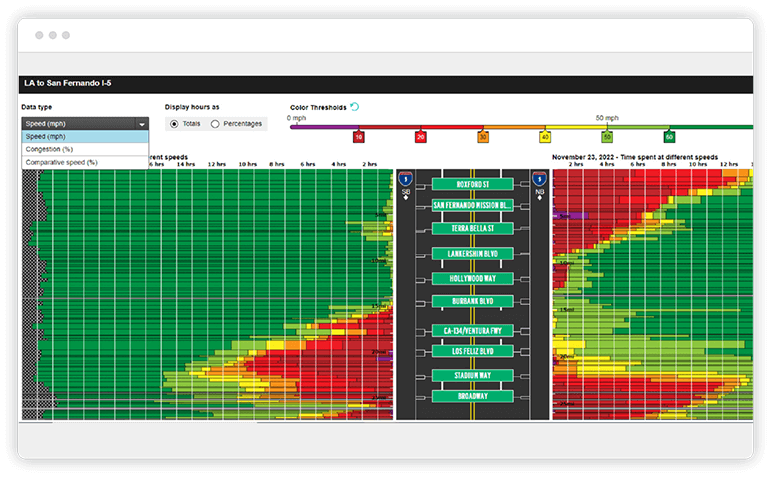
Visualize congestion measures by time spent at each speed on a stretch of road.
Access to this vital research can provide important time and money saving insights and help lead to numerous solutions related to easing traffic congestion, improving road conditions, addressing environmental issues, recommending infrastructure planning guidance, and much more.
Performance Charts
Performance Summaries
NPMRDS Coverage Map
User Delay Cost Analysis
Performance Charts
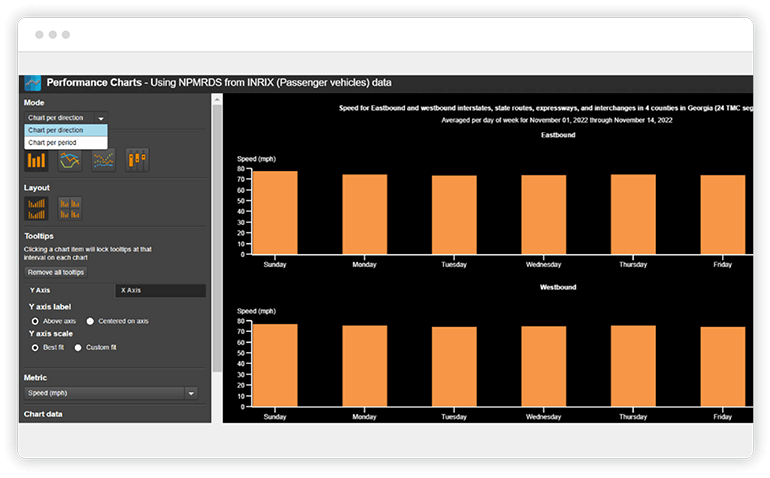
Chart performance metrics over time.
Performance Summaries
Report on Buffer Time Index, Planning Time Index, and other performance metrics.
NPMRDS Coverage Map
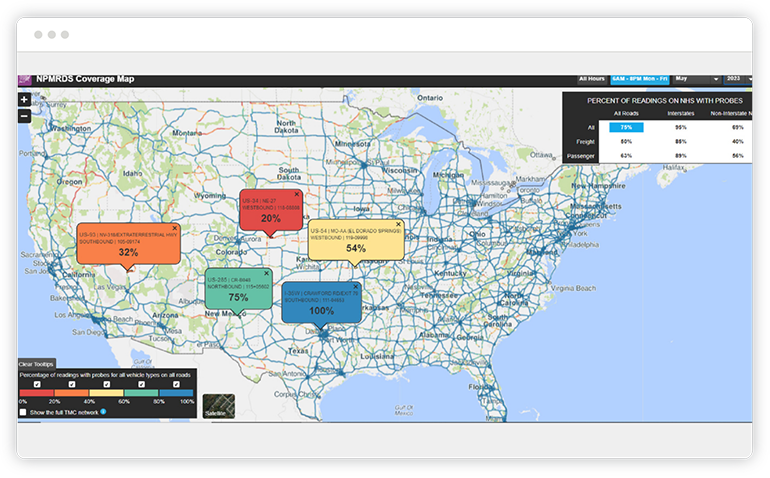
Explore the coverage completeness of the NPMRDS on a month-by-month basis.
User Delay Cost Analysis
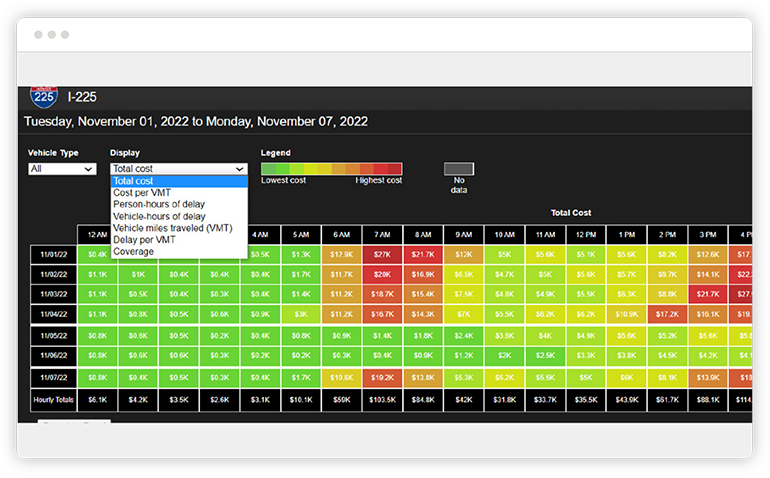
Put a dollar amount on how much a road’s performance impacts its users.
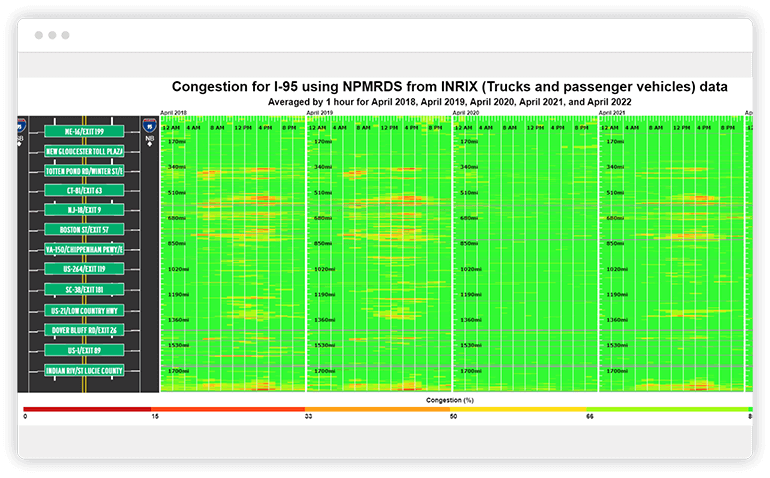
Deep-dive tools that offer real solutions
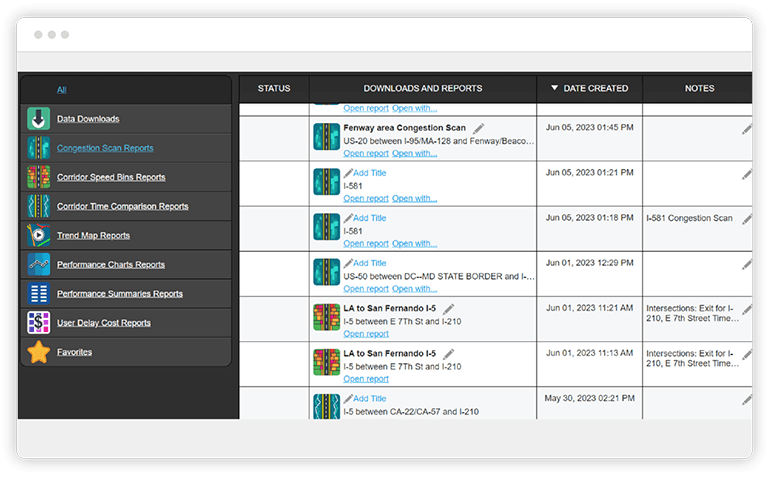
The National Transportation Data & Analytics Solution dataset is delivered via an advanced analytics platform with deep-dive tools that provide powerful features and visualizations, enabling custom mapping and analysis.
Unique and comprehensive dataset specifically designed for researchers, faculty, and students working in fields related to transportation, civil engineering, urban planning, and more.
Trusted data source of the U.S. Federal Highway Administration (FHWA)—relied upon to make investment and policy decisions that contribute to national performance goals. NPMRDS is an industry accepted dataset and uniquely addresses the specifications of the FHWA: there is no amputation of the data and clearly separates trucks from passenger vehicles data.
Includes 50 multi-disciplinary use cases from leading IEEE experts in transportation, mobility and related fields detailing how the platform can be used to facilitate and enhance research projects.